Cook County Tax Reassessment of Northfield
Don’t overlook your property tax re-assessment notice and the deadline to appeal. The Assessor has released Northfield’s commercial and residential assessment reports for the 2019 tax triennial which can be found here:
http://www.cookcountyassessor.com/assets/forms/NorthfieldCommercial.pdf
http://www.cookcountyassessor.com/assets/forms/NorthfieldResidential.pdf
Based on the published valuation statistics, the Assessor believes that the median sale price of residential properties in Northfield are as follows: $455,000 in 2013; $563,000 in 2015; $560,000 in 2016; and, $575,000 in 2019. The Assessor used these changes in market value to support a median percentage change in the township’s overall residential assessment of 23.25% in 2016 and 15.0% in 2019.
Even though the Assessor posted the 2019 residential assessment neighborhood map, he focused on limited or cherry-picked data from 2017 to 2019 for Northfield’s sales trends. The following is a comparison of the Overall Median Sales and Median Percentage Change regarding residential assessed values between the 2016 and 2019 reassessment periods by neighborhood:
Neighborhood 10
$537,500 (2016) vs. $946,809 (2019). 22.61% (2016) vs. 9.0% (2019)
Neighborhood 11
$401,000 (2016) vs. $432,406 (2019). 2.34% (2016) vs. -14.0% (2019)
Neighborhood 21
$530,500 (2016) vs. $588,125 (2019). 22.42% (2016) vs. 20.0% (2019)
Neighborhood 23
$529,000 (2016) vs. $731,575 (2019). 22.89% (2016) vs. 37.0% (2019)
Neighborhood 51
$570,000 (2016) vs. $640,000 (2019). 23.77% (2016) vs. 18.0% (2019)
Neighborhood 52
$508,500 (2016) vs. $570,000 (2019). 23.97% (2016) vs. 15.0% (2019)
Neighborhood 61
$369,500 (2016) vs. $333,500 (2019). 23.56% (2016) vs. -1.0% (2019)
Neighborhood 72
$304,500 (2016) vs. $349,000 (2019). 27.67% (2016) vs. 8.0% (2019)
Neighborhood 82
$1,240,000 (2016) vs. $950,000 (2019). 24.66% (2016) vs. -10.0% (2019)
Neighborhood 90
$463,500 (2016) vs. $505,000 (2019). 24.09% (2016) vs. 13.0% (2019)
Neighborhood 100
$609,500 (2016) vs. $696,000 (2019). 27.83% (2016) vs. 9.0% (2019)
Neighborhood 102
$490,500 (2016) vs. $568,750 (2019). 24.24% (2016) vs. 13.0% (2019)
Neighborhood 110
$649,000 (2016) vs. $943,750 (2019). 24.97% (2016) vs. 14.0% (2019)
Neighborhood 131
$527,000 (2016) vs. $615,000 (2019). 24.59% (2016) vs. 12.0% (2019)
Neighborhood 132
$447,500 (2016) vs. $482,000 (2019). 24.69% (2016) vs. 2.0% (2019)
Neighborhood 140
$553,000 (2016) vs. $600,000 (2019). 23.75% (2016) vs. 9.0% (2019)
Neighborhood 160
$607,500 (2016) vs. $575,000 (2019). 23.75% (2016) vs. 5.0% (2019)
Neighborhood 180
$721,500 (2016) vs. $975,000 (2019). 25.44% (2016) vs. 1.0% (2019)
Neighborhood 190
$635,500 (2016) vs. $560,000 (2019). 23.95% (2016) vs. -1.0% (2019)
Neighborhood 200
$820,500 (2016) vs. $850,000 (2019). 24.24% (2016) vs. 10.0% (2019)
Neighborhood 210
$670,500 (2016) vs. $764,750 (2019). 25.04% (2016) vs. 5.0% (2019)
Neighborhood 220
$871,000 (2016) vs. $1,041,250 (2019). 24.50% (2016) vs. 28.0% (2019)
Neighborhood 230
$509,500 (2016) vs. $589,000 (2019). 24.14% (2016) vs. 4.0% (2019)
Neighborhood 240
$730,500 (2016) vs. $720,000 (2019). 25.60% (2016) vs. 5.0% (2019)
Neighborhood 250
$344,500 (2016) vs. $370,000 (2019). 22.24% (2016) vs. -5.0% (2019)
Neighborhood 260
$367,500 (2016) vs. $450,750 (2019). 24.52% (2016) vs. 12.0% (2019)
Neighborhood 270
$345,000 (2016) vs. $383,000 (2019). 22.69% (2016) vs. 6.0% (2019)
Neighborhood 280
$302,500 (2016) vs. $348,000 (2019). 23.65% (2016) vs. 12.0% (2019)
Neighborhood 300
$958,500 (2016) vs. $742,500 (2019). 22.86% (2016) vs. 18.0% (2019)
Neighborhood 310
$1,073,500 (2016) vs. No Data (2019). 22.93% (2016) vs. 27.0% (2019)
Neighborhood 320
$990,000 (2016) vs. $597,500 (2019). 23.54% (2016) vs. 113.0% (2019)
Neighborhood 350
$434,500 (2016) vs. $375,000 (2019). 22.12% (2016) vs. -9.0% (2019)
Neighborhood 400
$576,500 (2016) vs. $675,000 (2019). 24.41% (2016) vs. 10.0% (2019)
Neighborhood 420
$473,500 (2016) vs. $532,500 (2019). 22.45% (2016) vs. 10.0% (2019)
Neighborhood 430
$420,500 (2016) vs. $450,000 (2019). 24.87% (2016) vs. 24.0% (2019)
As the primary component of your real estate tax bill, your tax assessment continues to fluctuate and its reduction is critical in reducing your tax liability.
Regarding the apartment, commercial, industrial and office properties, the proposed changes in assessed values are summarized in the following excerpt from Page 11 the Assessor’s commercial report:
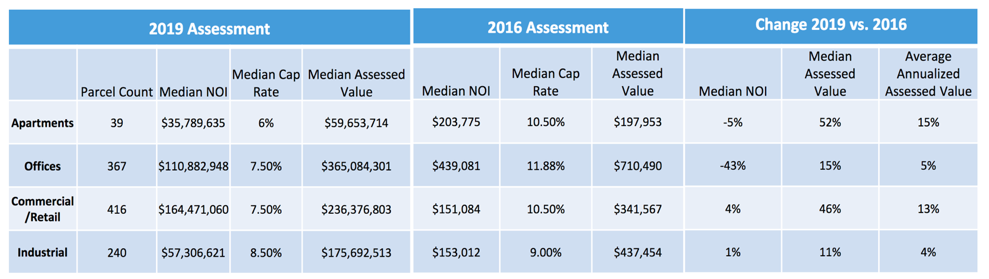
The Assessor has employed a computer assisted mass appraisal method that used data points from various opinions of value. Simply, the Assessor, from an investment perspective, focused on income and broad, unadjusted market data (Appendix A – Median Rents and Vacancy on Page 13) to materially lower the Cap Rates for all property types (Appendix B – Cap Rate Tables on Page 14) resulting in disparity as well as disproportionate changes in assessed values throughout the township as shown in the above excerpt.
Given the challenge of revaluing all properties in the North Suburbs and Cook County, it can be difficult for the Assessor to fully understand specific challenges facing your property since his office does not take the time to review nor make special considerations for your property’s unique aspects. Therefore, property owners and tenants should start by contacting our firm for a prompt review of the 2019 assessed value for the property taxes payable in 2020 and the remainder of the current triennial period.
Dimitrios P. Trivizas, Ltd., has successfully filed tax appeals, negotiated settlements and litigated tax complaints on a variety of properties ensuring real property tax savings and tax refunds for property owners and tenants across all Counties in Illinois.